ORf Interaction Ontology Network (ORION) 
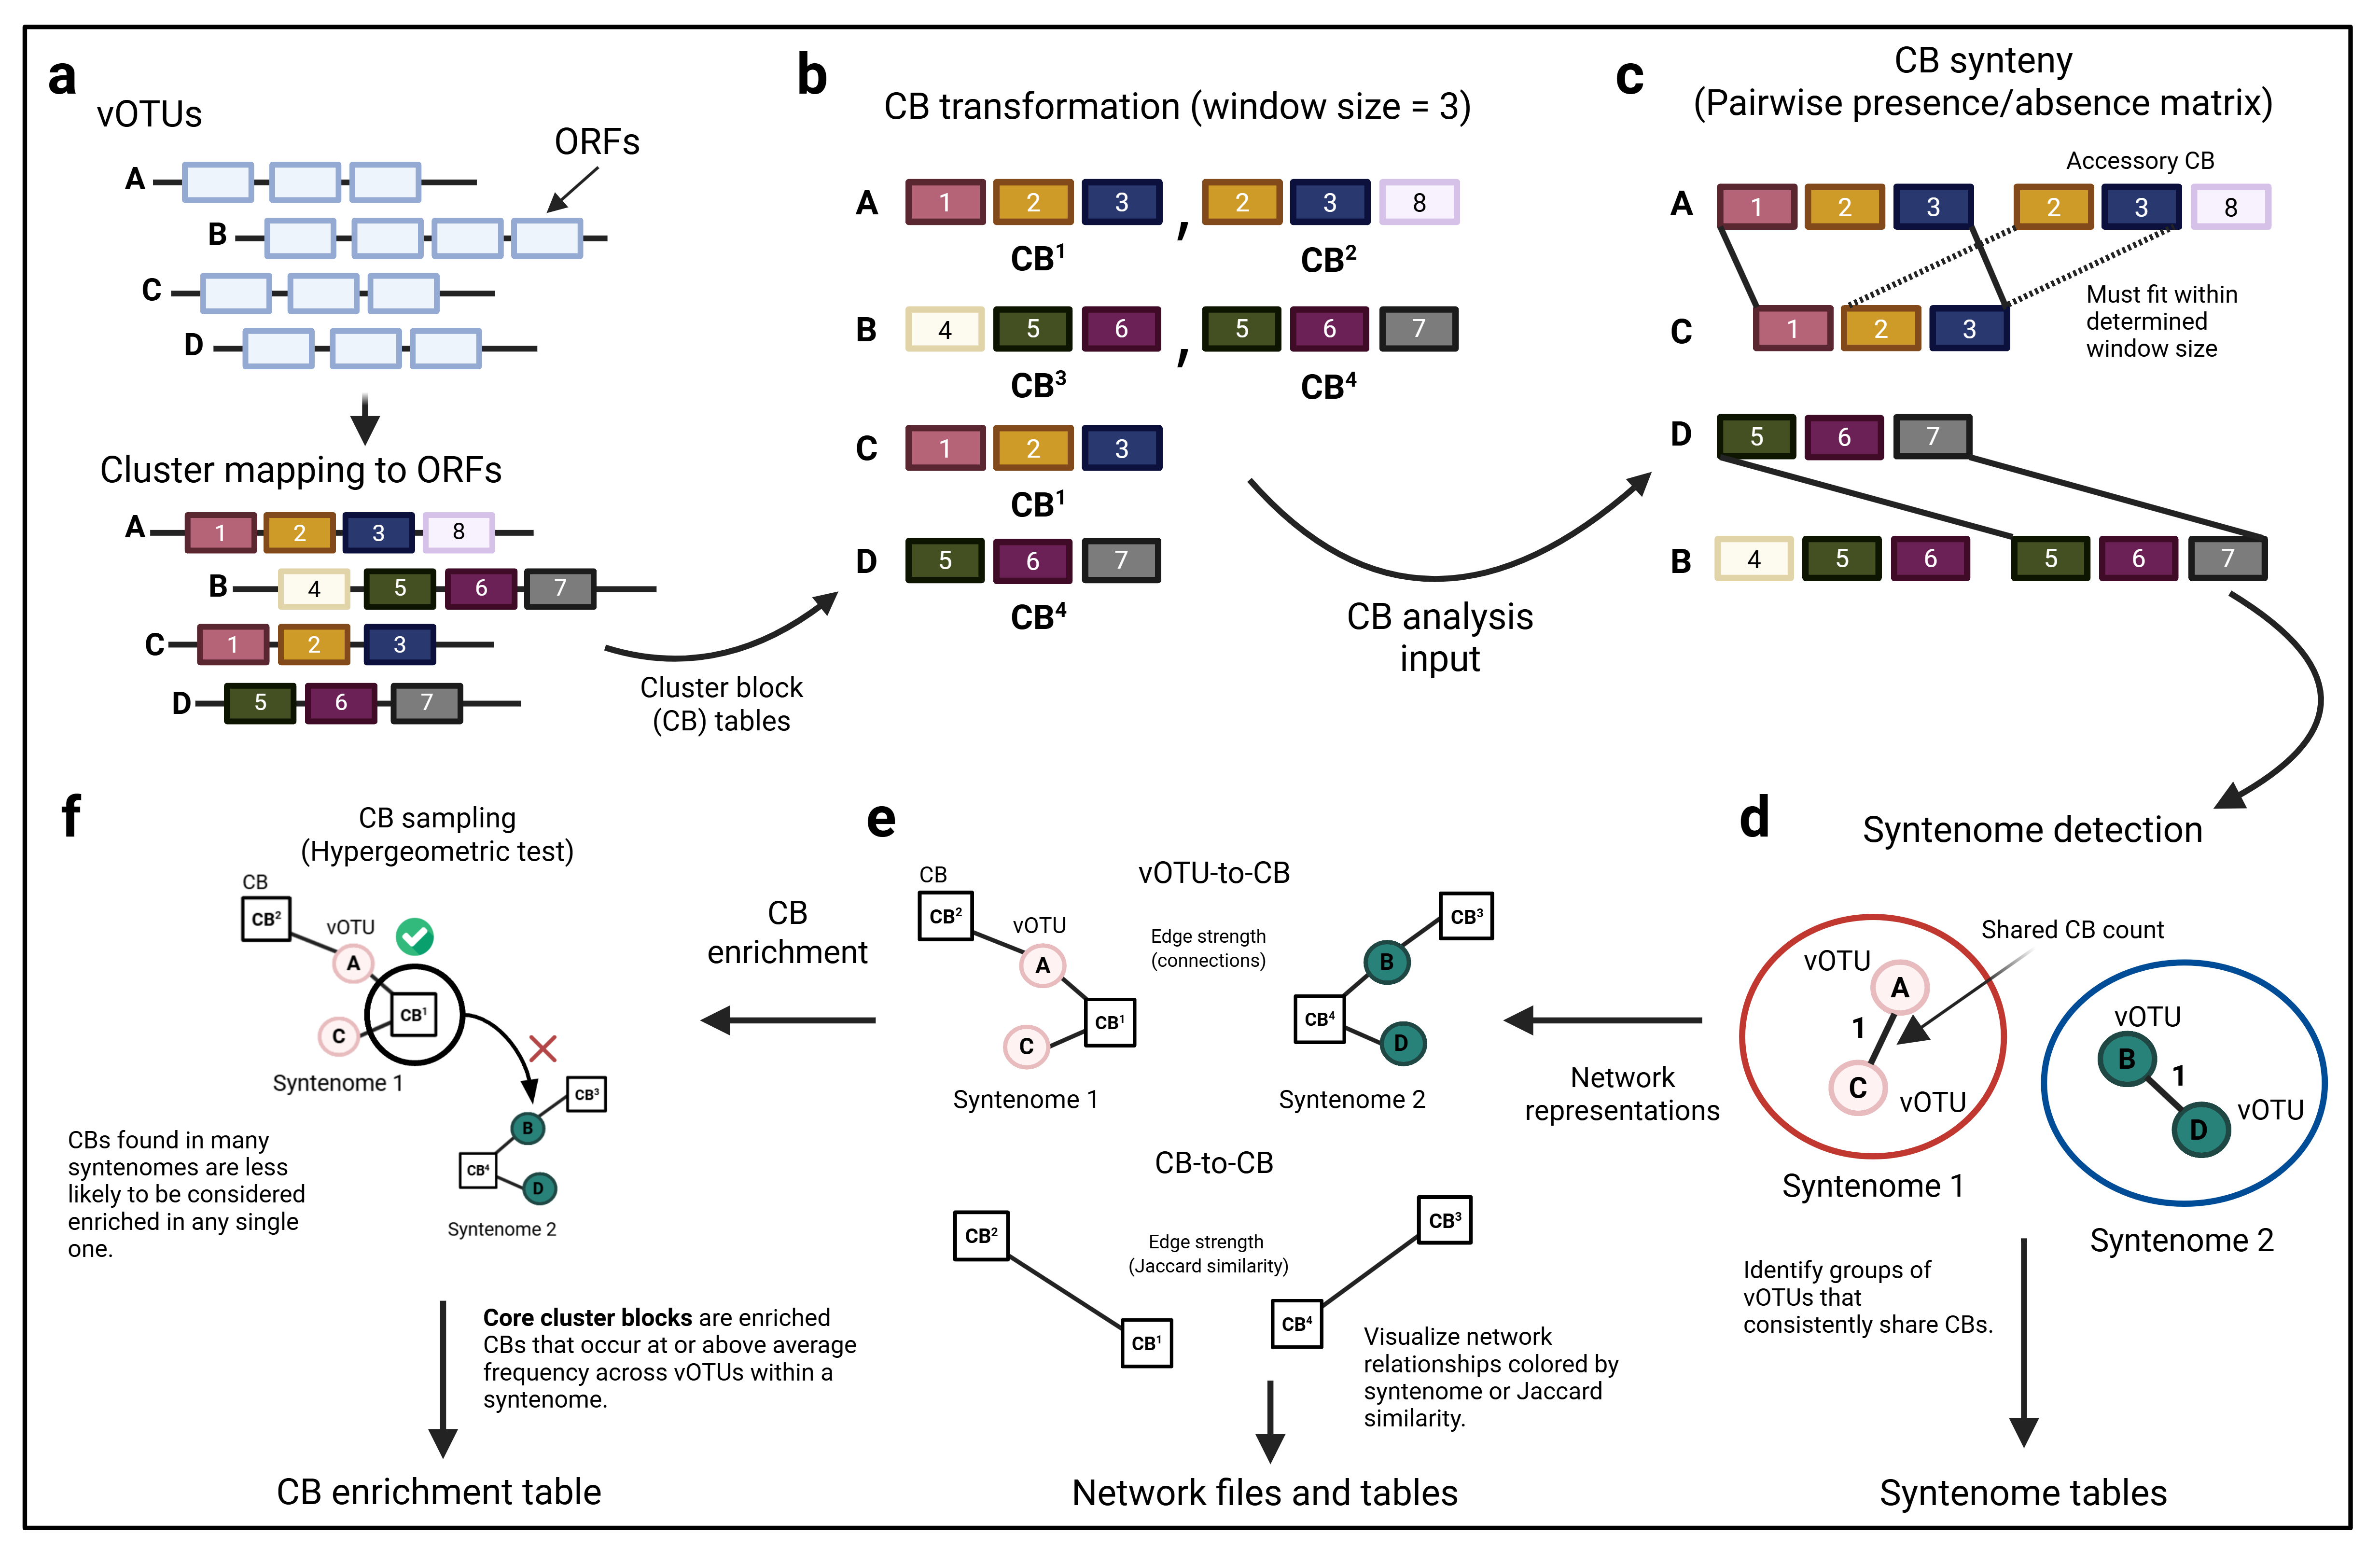
ORf Interaction Ontology Network (ORION), a computational framework designed to explore patterns of protein cluster (PC) organization across genomes, contigs, or viral operational taxonomic unit (vOTU) sequences.
Description
Understanding how proteins are functionally organized across genomes requires more than sequence similarity alone. Co-occurring genes often reflect co-functional relationships shaped by evolutionary pressure, and these neighborhood patterns can reveal biological logic that individual protein analysis misses.
ORION detects shared genomic features by analyzing the local arrangement of protein clusters (PCs) around each open reading frame (ORF). It maps each ORF position to its corresponding PC, then defines cluster blocks (CBs) using a sliding window of user-specified length. For example, a window size of three includes the focal PC plus its immediate neighbors; larger windows capture more distant PCs. By comparing the relative order of PCs within each window, ORION maintains consistent pattern matching even when ORFs shift due to rearrangements. Increasing the window size tightens the required cluster arrangement, revealing more highly conserved synteny across genomes.
Dependencies
orioncan be ran either on a machine with a properly set up python environment or by creating a custom Conda environment if you do not wish to change your current setup (recommended).
Installation
- I recommend using Mamba for faster dependency resolution; see the Mamba installation guide. If you prefer Conda, refer to the Conda installation guide.
#Retrieve repo
git clone https://github.com/zschreib/orion
cd orion

#Create environment (conda may be slow)
mamba env create -f environment.yml

#Activate environment

mamba activate orion
#OR
conda activate orion
- Tool Check. If you receive any errors here do not proceed until fixed.
mmseqs -h
prodigal -h
#Make sure version matches main branch.
python main.py --version
Running ORION
usage: main.py [-h] -i INPUT -p PREFIX [--min-seq-id MIN_SEQ_ID] [-cb CLUSTER_BLOCK] [-min MIN_GENOMES] [-jci JACCARD] [-t THREADS] [-f {graphml,csv}] [--version]

Pipeline: preprocess FASTA and run ORION into one results folder

options:
  -h, --help            show this help message and exit
  -i, --input INPUT     Path to input FASTA file. Nucleotide genomes/contigs.
  -p, --prefix PREFIX   Base name for results directory (creates <prefix>_results)
  --min-seq-id MIN_SEQ_ID
                        MMseqs2 min amino acid sequence identity for clustering. Default = 0.3 or 30%.
  -cb, --cluster-block CLUSTER_BLOCK
                        Cluster block size for ORION. Default = 3.
  -min, --min-genomes MIN_GENOMES
                        Minimum genomes for conserved cluster‑block. Default = 5.
  -jci, --jaccard JACCARD
                        Jaccard threshold for cluster block co‑occurrence visual. Default = 0.25.
  -t, --threads THREADS
                        Number of worker threads for ORION. Default = 1
  -f, --format {graphml,csv}
                        Output format for networks. Recommend csv for Cosmograph or graphml for Cytoscape. Default csv.
  --version             Show program version and exit.
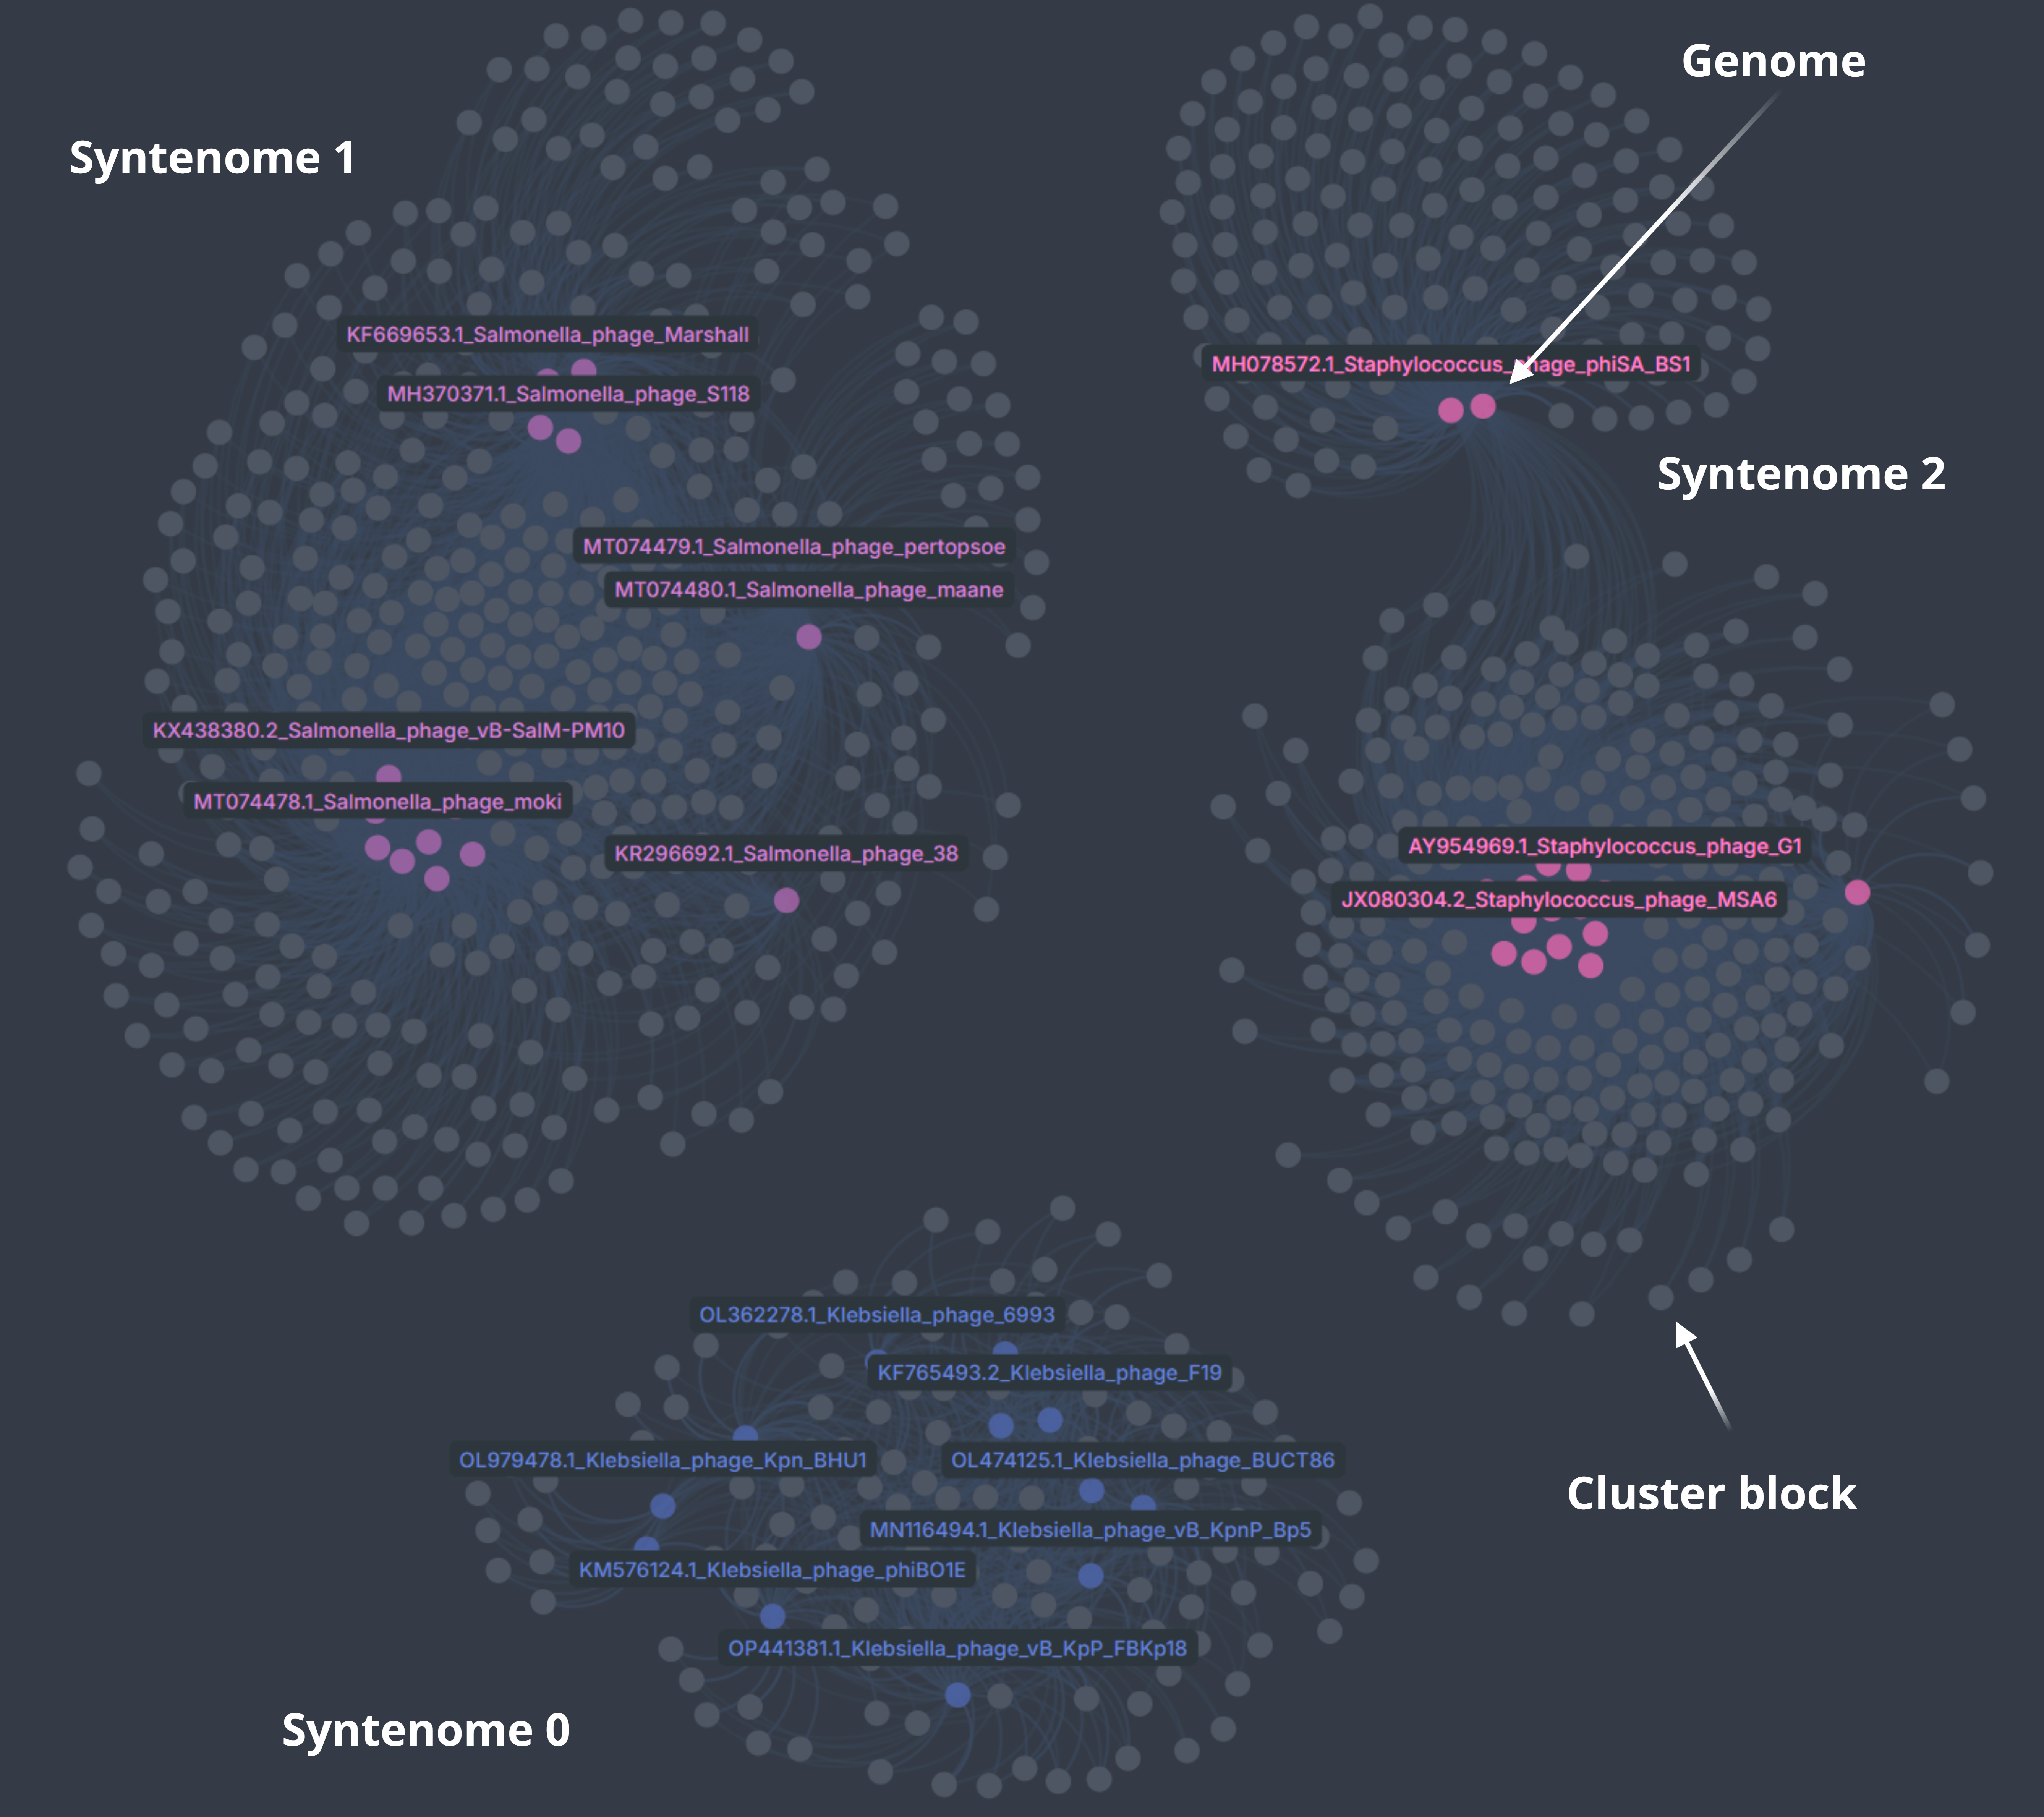
- Example run: ORION applied to the NCBI test dataset, which contains 48 phage genomes (16 Klebsiella, 16 Staphylococcus, and 16 Salmonella phage).
python main.py -i NCBI_test_input/kleb_sal_staph_48_phage.fasta -p NCBI_test --min-seq-id 0.3 -cb 3 -min 3 -f csv
Process parameters: clusters amino acid ORFs at 30% identity (--min-seq-id 0.3), generates cluster blocks of size 3 (-cb 3), retains blocks found in ≥3 genomes (--min 3), saves output to a prefix‑named directory (-p), and exports networks in CSV format (-f csv). To see more options use (python main.py -h).
Results
NCBI_test_results/
├── NCBI_test_job_logs.txt
├── orion_output
│   ├── analysis_data
│   │   ├── block_enrichment_scores.tsv
│   │   ├── block_jaccard_scores.tsv
│   │   └── genome_enriched_blocks.tsv
│   └── networks
│       ├── cluster_block_jaccard_metadata.csv
│       ├── cluster_block_jaccard_network.csv
│       ├── genome_to_cb_metadata.csv
│       └── genome_to_cb_network.csv
└── preprocess_output
    ├── NCBI_test_cluster_blocks.tsv
    ├── NCBI_test_mmseqs_cluster_membership.tsv
    ├── NCBI_test_orf_metadata.tsv
    └── NCBI_test_orfs.pep
Network Visuals
Depending on the chosen format (-f), networks can be visualized in Cytoscape or Cosmograph. Since Cosmograph does not accept GraphML, we’ll use CSV files:
-
Open Cosmograph:
Go to Cosmograph. -
Upload files:
- Drag
genome_to_cb_network.csvinto Select data file -
Drag
genome_to_cb_metadata.csvinto Select metadata file -
Map columns:
- Set Source column →
Source -
Set Target column →
Target -
Launch the network:
Click Launch to render the graph. -
Color nodes by syntenome:
In the left panel under Node color by, choose metadata | syntenome.
This will color genomes based on shared cluster block composition (syntenomes) and leave cluster block nodes gray. Highly shared blocks will draw their connected genomes toward the center.
Citation
If you found this tool useful, please cite:
Schreiber, Z. D. ORION: ORf Interaction Ontology Network. GitHub. Retrieved July 29, 2025, from https://github.com/zschreib/orion/.
Authors
Contributors names and contact info.
zschreib@udel.edu
License
This project is licensed under the GNU General Public License v3.0 see the LICENSE file for details
Acknowledgments
Visuals provided by Cosmograph